PHOTO
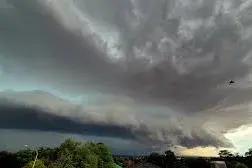
Rainfall figures recorded in 2025 reveal how the year’s total rainfall compared with previous years and their averages, with totals showing whether conditions have been wetter, drier or mainly in line with long-term averages.
Comparing historical rainfall data records highlights variable rainfall totals throughout the years.
Meteorologists note that variability is a defining feature of inland NSW’s climate, but for local communities, rainfall totals are not just numbers – they influence local economies, sporting grounds, water restrictions and especially farming procedures.
Some years stand out with prolonged dry spells, while other years are determined by above-average rainfall.
Long-term averages provide a guide to understand how recent years compare, which can often help local farmers prepare for cropping season.
For Narrandera, rainfall in 2025 totalled 304.6 millimetres, according to the Australian Bureau of Meteorology statistics.
Narrandera’s wettest month last year was December when 63.4mm fell.
Narrandera’s wettest day last year was on 11 September when 37.2mm was recorded.
The driest month last year in Narrandera was April when just 6.6mm was recorded during a downpour on a single day (27 April).
Last year’s low April rainfall figures for Narrandera are a stark comparison to the
town’s wettest ever day when 80.6mm was recorded on
11 January, 1974.
The median is usually the preferred measure of average rainfall from the meteorological point of view.
While referring to the median system, last year’s rainfall in Narrandera was slightly lower than the median of 355.2mm when 304.6mm was recorded during the 12 months of 2025.
Sustained rainfall events, rather than one-off downpours, often lead to a wetter than usual year, in which rainfall has exceeded the average.
Even shortfalls of a few millimetres falling each month can add up during the course of the year, shifting the balance from favourable to challenging conditions for crop growers.
Comparisons with standout wet years also help put current figures into context.
Each new rainfall event adds to the overall total and shapes comparisons with past seasons.
Weather, especially excessive rainfall - or the lack of it – is a common topic of discussion.
Whether total rainfall figures for the year tally up to be above or below average, the data provides vital information, adding another chapter in the long record system that helps locals measure how the year is remembered.
Regarding the rainfall in NSW for February through to April, the Bureau of Meteorology’s long-range forecast predicts below or near-average rainfall for much of Australia.
It also predicts rainfall is likely to be below average (60 per cent to 70 per cent chance) for south-east Australia.
Note: Rainfall figures sourced from the Australian Bureau of Meteorology.